A typing test WPM score only becomes comparable when you normalize for test duration and text difficulty. The practical approach is to convert each run into normalized WPM using one baseline format, then compare trends on that normalized value instead of raw speed alone. If you run mixed test formats each week, this method gives you cleaner progress signals and fewer false conclusions.
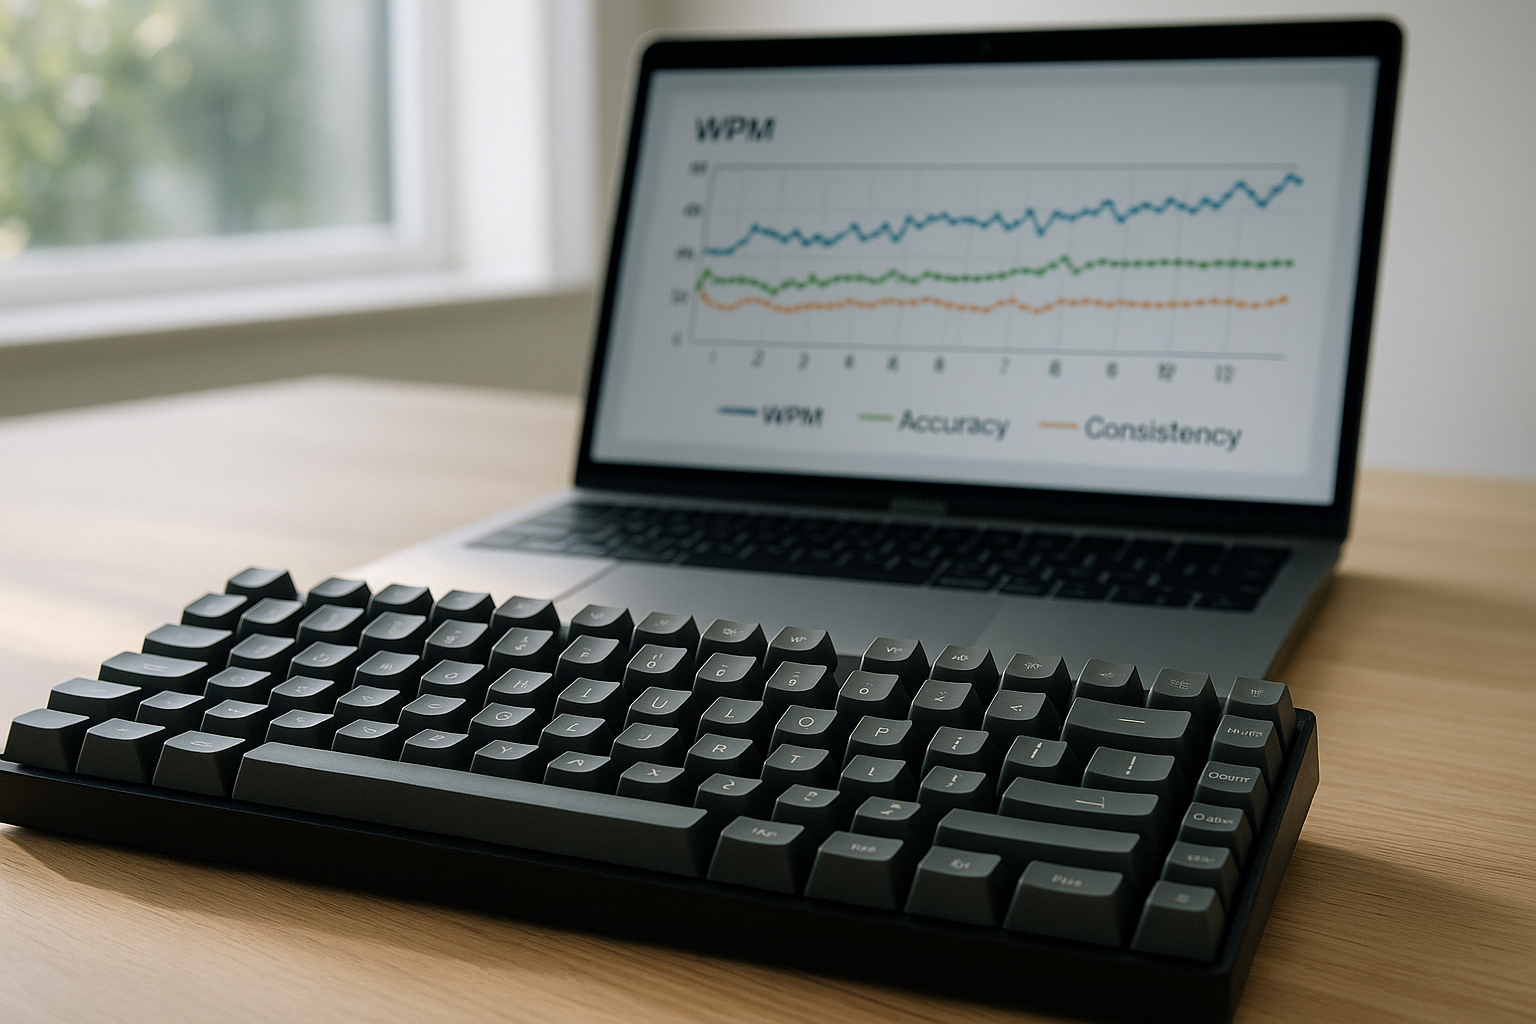
Most typists switch between short and long runs, easy and hard passages, and different devices. Raw WPM moves around because test conditions changed, not because skill changed. A 15 second burst can overstate pace, while a 120 second run often exposes fatigue and correction cost.
If you need baseline consistency first, start with the warmup protocol. If you want transfer focused scoring, pair this with effective WPM tracking. For workload specific targets, use task benchmark bands.
# Why raw typing test WPM creates noisy decisions
Raw WPM is sensitive to setup and format variance.
- Short tests amplify acceleration and opening rhythm.
- Easy passages reduce error pressure and inflate speed.
- Long tests expose consistency and correction behavior.
- Different sessions include different fatigue levels.
Human motor performance follows a speed precision tradeoff under time pressure, which means pace gains can increase error risk when control is unstable (Fitts law overview (opens new window)). Platform level input behavior can also affect measured rhythm and repeated key behavior in edge cases (Microsoft keyboard input documentation (opens new window)). For firmware level switch processing, debounce handling can alter perceived key registration consistency (QMK debounce documentation (opens new window)).
Operationally, the implication is direct. Without normalization, one score can describe a test format more than your typing ability.
# A practical normalization model you can run weekly
Use one reference format as your baseline:
- Duration baseline: 60 seconds.
- Difficulty baseline: mixed text.
- Device baseline: your primary keyboard and usual setup.
Then convert each run to normalized WPM.
normalized WPM = raw WPM × duration factor × difficulty factor × quality factor
Where:
duration factoradjusts for short burst inflation or long run fatigue.difficulty factoradjusts for easier or harder passage sets.quality factoradjusts for error burden.
A starting set of factors that works for most typists:
- 15 second run: duration factor 0.92
- 30 second run: duration factor 0.96
- 60 second run: duration factor 1.00
- 120 second run: duration factor 1.03
Difficulty factors:
- Easy text: 0.95
- Mixed text: 1.00
- Hard text: 1.05
Quality factor:
- 99 to 100 percent accuracy: 1.00
- 98 to 98.9 percent: 0.99
- 97 to 97.9 percent: 0.97
- 96 to 96.9 percent: 0.95
- Below 96 percent: 0.92
These are calibration defaults. After two weeks, tune factors using your own data.
# Decision table for interpreting normalized typing test WPM
Use this table at the end of each week.
| Observed pattern | Likely meaning | Next action |
|---|---|---|
| Raw WPM up, normalized WPM flat | Format got easier, skill trend unchanged | Keep same training focus, hold targets |
| Raw WPM flat, normalized WPM up | Harder formats handled better | Continue current block for one more week |
| Raw WPM up, normalized WPM up, quality stable | Real speed gain with control | Increase target pace by 1 to 2 WPM |
| Raw WPM up, normalized WPM down | Error cost or inconsistency increasing | Shift to precision drills for 5 to 7 days |
| Both raw and normalized down | Fatigue, setup drift, or overload | Reduce volume, recheck warmup and schedule |
This keeps decisions tied to transferable output instead of headline spikes.
# Build your weekly normalization sheet in 10 minutes
Track each run with the same columns:
- date and session time
- run duration (15, 30, 60, 120)
- passage difficulty (easy, mixed, hard)
- raw WPM
- accuracy
- correction burden (low, medium, high)
- normalized WPM
- one short error note
A simple correction rule for quality factor when accuracy alone feels too coarse:
- low correction burden: no extra penalty
- medium burden: minus 0.5 normalized WPM
- high burden: minus 1.5 normalized WPM
Apply this after the formula. This captures time lost to backtracking that accuracy percentages can hide.
# Worked example with mixed test formats
Assume one week of sessions:
- Run A: 15 seconds, easy text, raw 86 WPM, 97.8 percent accuracy
- Run B: 60 seconds, mixed text, raw 74 WPM, 98.6 percent accuracy
- Run C: 120 seconds, hard text, raw 68 WPM, 98.1 percent accuracy
Apply factors.
Run A:
- duration factor 0.92
- difficulty factor 0.95
- quality factor 0.97
- normalized WPM = 86 × 0.92 × 0.95 × 0.97 = 72.9
Run B:
- duration factor 1.00
- difficulty factor 1.00
- quality factor 0.99
- normalized WPM = 74 × 1.00 × 1.00 × 0.99 = 73.3
Run C:
- duration factor 1.03
- difficulty factor 1.05
- quality factor 0.99
- normalized WPM = 68 × 1.03 × 1.05 × 0.99 = 72.8
Interpretation:
Raw values appear far apart, from 68 to 86. Normalized values cluster tightly around 73. Skill level is stable across formats. The large raw gap came from test structure, not a sudden performance jump.
This is exactly the kind of false signal normalization removes.
# How to calibrate factors with your own data
Use a 14 day calibration block.
# Step 1: lock one baseline slot
Pick two baseline sessions per week:
- 60 second, mixed difficulty, same time window, same setup.
This becomes your anchor.
# Step 2: collect controlled comparison runs
For each alternate format, gather at least 10 runs compared to baseline week medians.
- 10 runs at 15 seconds mixed.
- 10 runs at 120 seconds mixed.
- 10 runs at 60 seconds easy.
- 10 runs at 60 seconds hard.
# Step 3: derive empirical factors
For each format:
factor = baseline median / format median
If your baseline median is 72 and your 15 second mixed median is 77, duration factor for 15 seconds becomes 72/77 = 0.935.
Use rounded factors to three decimals and keep them fixed for the next month.
# Step 4: review monthly
If keyboard hardware, layout, or schedule changes, run another calibration block. Otherwise keep factors stable so trends stay comparable.
For hardware related variance control, this keyboard speed benchmark process helps isolate device effects before changing factors.
# Weekly checklist to keep normalized WPM reliable
- [ ] At least two baseline format sessions completed.
- [ ] Test durations logged for every run.
- [ ] Difficulty labels applied consistently.
- [ ] Accuracy recorded to one decimal place.
- [ ] Same keyboard and layout used for comparison week.
- [ ] Normalized median computed before deciding next training focus.
If any line is missing, treat that week as exploratory data, not a progression decision week.
# Common mistakes and direct fixes
# Mistake: changing factors every few days
Frequent factor edits erase trend continuity.
Fix: lock factors for one month unless major setup changes occur.
# Mistake: mixing text pools without labels
Unlabeled text difficulty makes normalization weak.
Fix: tag each run as easy, mixed, or hard immediately after completion.
# Mistake: using best run for planning
Best runs are volatile.
Fix: use median normalized WPM for weekly decisions, and keep best run as a side note.
# Mistake: pushing speed while quality drops
Higher pace with rising correction burden lowers real output.
Fix: hold pace target and train precision until quality factor stabilizes.
If you are currently stuck, this plateau diagnosis workflow gives a structured way to choose one bottleneck at a time.
# What a good normalized typing test WPM target looks like
A useful target has three properties:
- It is based on normalized median, not single run peaks.
- It includes an accuracy floor matched to your workload.
- It changes slowly, usually by 1 to 2 WPM per week at most.
Typical working accuracy floors:
- general writing: 97 percent
- coding and symbol heavy work: 96 percent with explicit symbol checks
- structured entry work: 98 percent
Pair those floors with normalized WPM medians and you get targets that transfer to real tasks.
# 30 day action plan
Week 1:
- Set factors from defaults.
- Start logging normalized WPM for every run.
Week 2:
- Collect enough alternate format data for first calibration.
- Update factors once at week end.
Week 3:
- Train one bottleneck using normalized median as progress metric.
- Keep test schedule and setup stable.
Week 4:
- Review trend line.
- Decide one change for next month: pace target, difficulty mix, or session duration balance.
This cadence keeps training measurable and prevents overreacting to noisy daily scores.
Typing test WPM becomes a decision tool when you normalize across duration, difficulty, and quality. Track normalized medians weekly, calibrate factors from your own data, and adjust one variable at a time. That gives you cleaner progress signals and speed gains that hold up outside the test screen.