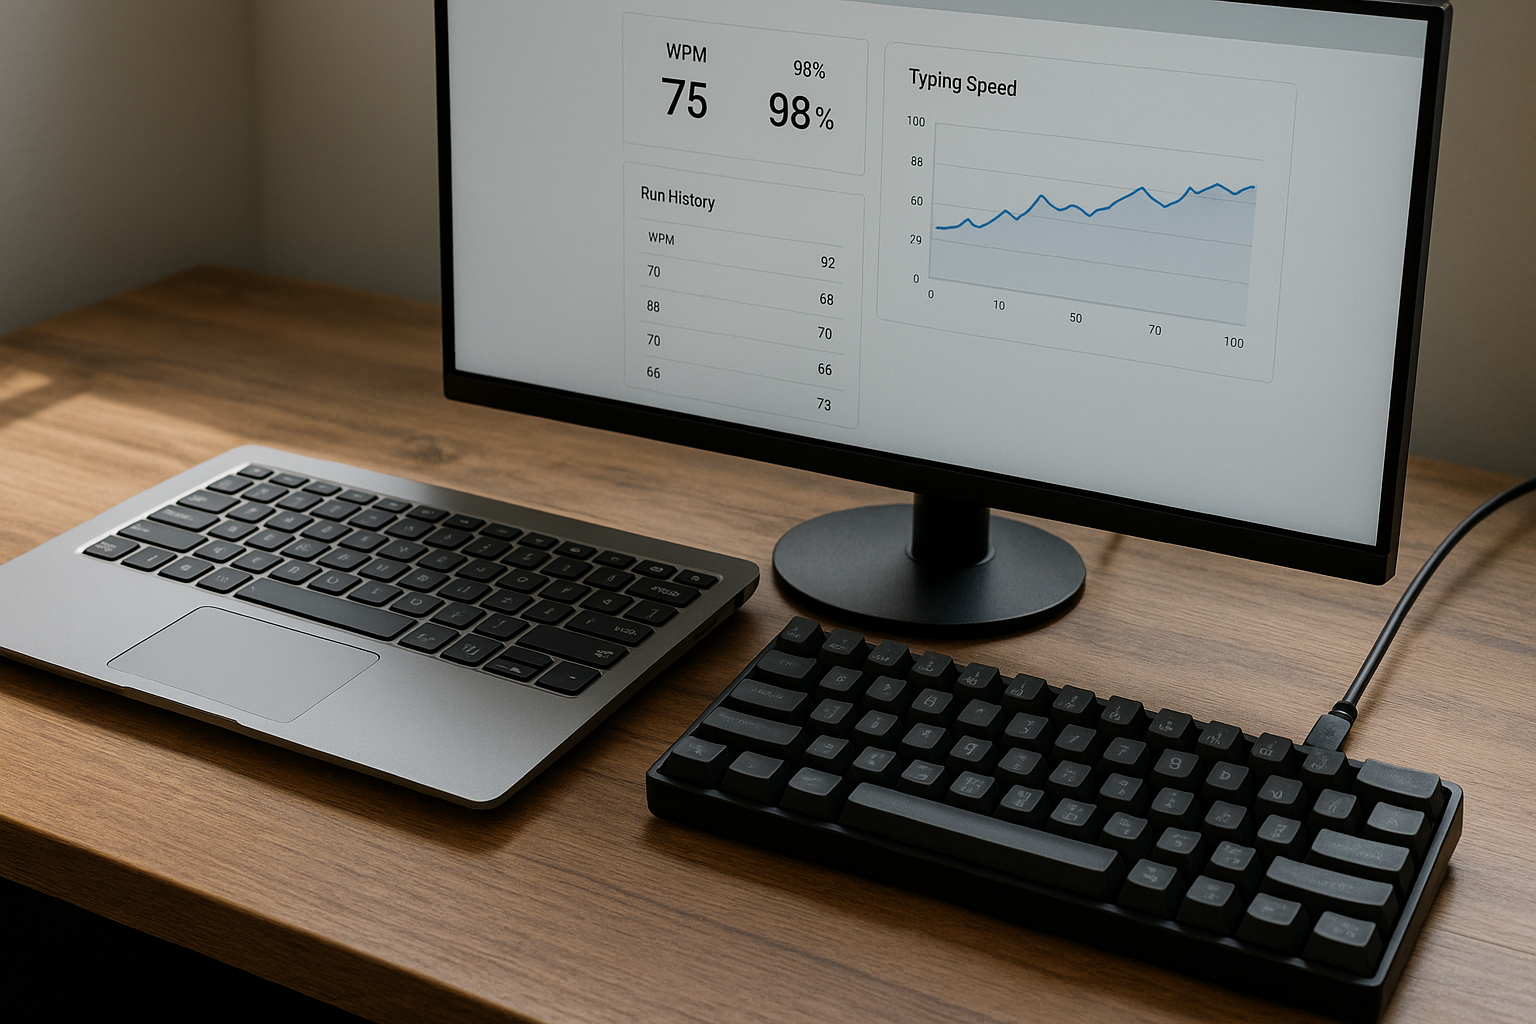
A speed test keyboard comparison works when you run it as a controlled A/B test. Use the same text difficulty, session timing, and scoring model across both keyboards, then decide from median effective WPM and error stability instead of one peak run. This guide gives you a repeatable protocol you can finish in one week.
Most people compare keyboards with one quick run, see a higher number, and call it done. That method produces noisy results. Setup differences, warmup quality, and fatigue can outweigh actual hardware differences.
If you want cleaner baseline data first, use this typing skills scorecard framework. If your first run quality is unstable, run the warmup protocol. If your scores have flattened for weeks, pair this test with plateau diagnosis.
# Why most speed test keyboard comparisons fail
The usual comparison has three structural problems.
First, people mix test durations. A 15 second burst favors acceleration. A 120 second passage emphasizes fatigue control and correction behavior.
Second, they switch text difficulty between runs. Easier passages inflate speed and hide transition errors.
Third, they compare raw WPM only. Raw speed ignores correction cost, which matters for real output.
Motor performance research has shown a persistent speed precision relationship in aimed movements and fine control tasks. Typing follows the same tradeoff pattern in practice sessions and production work (Fitts law reference (opens new window)). For input timing behavior and keyboard event handling details, platform documentation is useful context when troubleshooting inconsistent results (Microsoft keyboard input overview (opens new window)). For firmware level behavior such as switch debouncing, QMK documentation explains why repeated key behavior can vary across configurations (QMK debounce docs (opens new window)).
The practical implication is straightforward. If you do not control test conditions, the result does not tell you which keyboard supports better typing performance for your workflow.
# What to measure in a speed test keyboard experiment
Use one primary metric and two guardrails.
Primary metric:
- Median effective WPM over a full session block.
Guardrails:
- Median accuracy.
- Consistency spread, which is highest run WPM minus lowest run WPM.
Effective WPM is useful because it prices error cleanup. A simple model is enough:
effective WPM = raw WPM × accuracy - correction penalty
Where correction penalty can be:
- 0.5 for low correction burden.
- 1.5 for medium correction burden.
- 3.0 for high correction burden.
This is the same direction used in practical score based workflows where usable output matters more than headline peaks.
# Decision table for laptop vs mechanical keyboard outcomes
Use this table after each keyboard completes at least 15 scored runs.
| Observed result | Interpretation | Next action |
|---|---|---|
| Mechanical board has +3 or more median effective WPM and equal or better accuracy | Clear typing throughput gain | Keep mechanical board for main typing sessions |
| Mechanical board is faster but accuracy drops by more than 1.0 point | Unstable gain with correction debt | Adjust actuation, keycaps, or return to laptop for high precision work |
| Laptop has equal effective WPM with tighter consistency spread | Familiarity advantage outweighs hardware | Keep laptop keyboard, retest after targeted adaptation block |
| Both are within 1 effective WPM and 0.5 accuracy points | No meaningful hardware difference in current setup | Decide by ergonomics, portability, and noise tolerance |
| Mechanical board starts lower but trend improves over 5 to 7 sessions | Adaptation phase in progress | Continue adaptation before final decision |
This table keeps your decision tied to repeatable evidence.
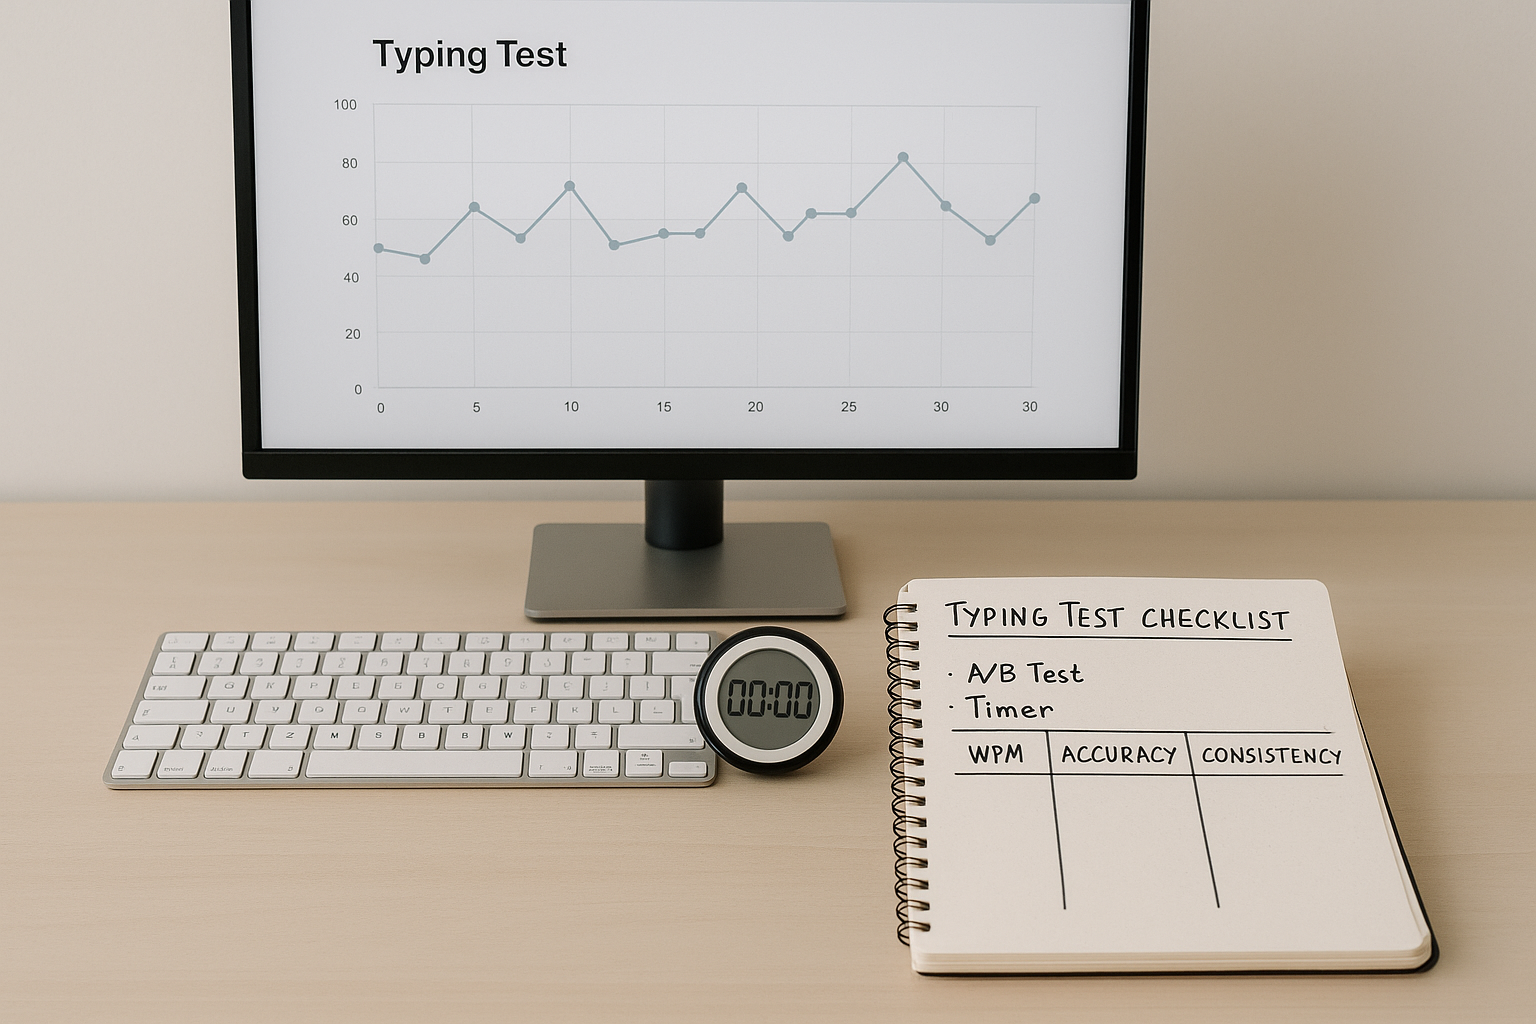
# A seven day speed test keyboard protocol
Run this for one week. It gives enough volume to separate random variance from real change.
# Day 0 setup
Lock conditions before first scored run.
- Use one browser and one zoom level.
- Fix run length at 60 seconds.
- Use the same test platform and language.
- Keep session window consistent, such as 19:00 to 20:00 daily.
- Keep desk posture and chair height consistent.
Do not tune switch settings midweek unless both keyboards receive the same treatment. Mid protocol changes break comparability.
# Day 1 to Day 3 baseline on keyboard A
Pick the keyboard you currently use most.
Per session:
- Warm up for 6 to 8 minutes.
- Run five scored 60 second tests.
- Tag each run correction burden as low, medium, or high.
- Log one short error note.
# Day 4 rest or light transfer day
Run only one short real world writing block.
- 10 to 15 minutes of email drafting, note taking, or coding comments.
- Record friction notes only.
This resets fatigue before the second keyboard block.
# Day 5 to Day 7 baseline on keyboard B
Repeat the exact structure from days 1 to 3.
The only variable that should change is keyboard hardware.
At end of day 7, compute medians for both keyboard blocks and apply the decision table above.
# How to avoid hidden bias in your keyboard speed test
Bias enters fast when one keyboard gets better conditions.
Common bias sources and controls:
- Order effect: The second keyboard can benefit from learning. Counter by repeating the experiment next week with reversed order.
- Fatigue drift: Late sessions reduce pace. Keep session time fixed across both blocks.
- Passage familiarity: Repeated passages can inflate speed. Use randomized prompts with similar difficulty.
- Motivation spikes: One board may feel more exciting. Commit to the same run volume regardless of early scores.
If you skip these controls, your result measures mood and schedule variance more than hardware impact.
# Interpreting results for different typing goals
A single winner for all contexts is rare. Use goal based interpretation.
# General writing and communication
Prioritize effective WPM and consistency spread. You need stable output more than occasional peak speed.
# Technical writing and coding
Track symbol error rate separately from total accuracy. Some boards feel fast on plain text but add errors on punctuation heavy work.
# Data entry or structured input
Set stricter accuracy floor, often 98 percent. A board that gains 2 WPM but increases field errors can reduce net productivity.
For benchmarking targets by workload, this task specific benchmark guide helps map realistic ranges.
# When hardware changes actually matter
Keyboard changes matter most when one of these is true:
- You are already near your current control ceiling and small latency or feel improvements reduce micro hesitations.
- Your current keyboard causes repeated discomfort or finger overreach.
- You do sustained typing sessions where cumulative fatigue costs more than peak speed gains.
Hardware changes matter less when:
- You are still building basic rhythm and error control.
- Session quality is dominated by inconsistent sleep, schedule, or warmup habits.
- You keep changing settings and never stabilize adaptation.
If your data shows tiny differences, focus on technique and session design first. Those usually move results faster than hardware swaps.
# Practical setup changes to test after the first A/B round
After the first full comparison, run one variable at a time for seven day mini cycles:
- Key switch weight change.
- Keycap profile change.
- Actuation distance adjustment on compatible boards.
- Wrist rest height and forearm angle.
For each mini cycle, keep the same scoring model and compare against your previous median effective WPM baseline.
This approach builds a decision trail you can trust instead of stacking random tweaks.
# A sample result interpretation
Example summary from a real style testing pattern:
- Laptop keyboard median effective WPM: 63.4
- Mechanical keyboard median effective WPM: 66.8
- Laptop median accuracy: 97.9%
- Mechanical median accuracy: 97.6%
- Laptop spread: 7.2 WPM
- Mechanical spread: 9.4 WPM
Interpretation:
- Mechanical board gives higher usable throughput.
- Variance is higher, which suggests adaptation is incomplete.
- Keep mechanical board for practice and long form drafting.
- Use laptop board for short precision critical tasks until spread narrows.
A result like this is actionable because it balances speed and control.
# Final recommendation workflow
At the end of your speed test keyboard comparison, use a fixed closeout rule:
- Choose the keyboard with higher median effective WPM if accuracy remains within 1 point.
- If accuracy gap exceeds 1 point, prioritize the higher accuracy board for production typing.
- If both are close, choose by comfort, portability, and noise, then retest in 30 days.
The goal is stable, transferable output. One screenshot score is interesting. A week of controlled data is useful.
Document your final setup in one place, including switch type, keycap profile, debounce settings, and desk posture. Reproducing conditions protects your next comparison from memory bias.
If you want to continue improving after hardware selection, run a two week progression where you keep keyboard hardware fixed and only train one bottleneck. This keeps your performance trend readable and prevents attribution errors.